Reaction equation
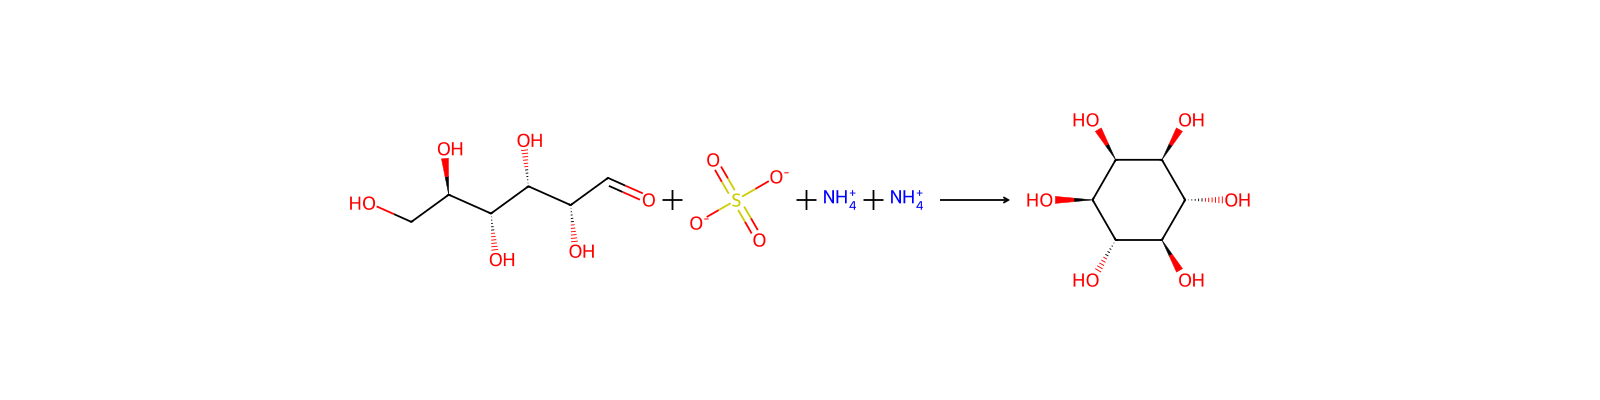
[O:1]=[CH:2][C@@H:3]([C@H:5]([C@@H:7]([C@@H:9]([CH2:11][OH:12])[OH:10])[OH:8])[OH:6])[OH:4].S([O-])([O-])(=O)=O.[NH4+].[NH4+]>>[C@@H:11]1([OH:12])[C@@H:2]([OH:1])[C@H:3]([OH:4])[C@@H:5]([OH:6])[C@@H:7]([OH:8])[C@H:9]1[OH:10]Participants
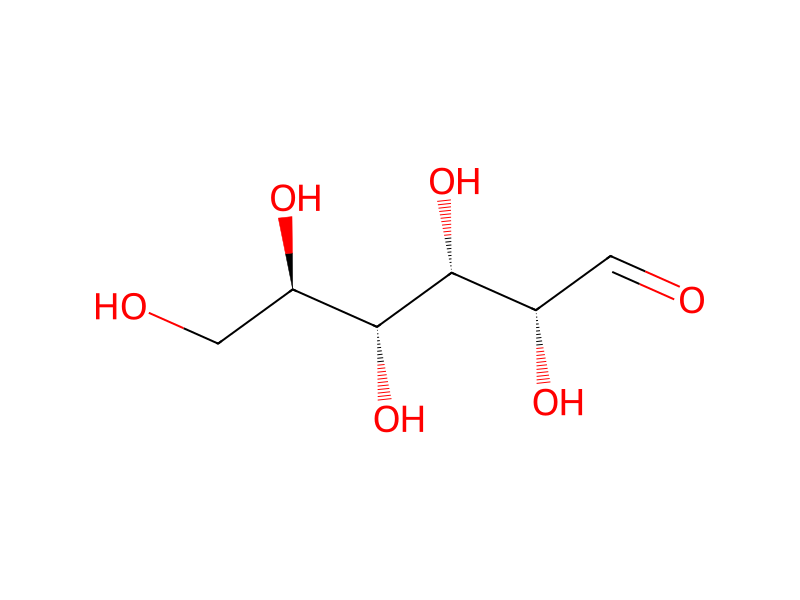
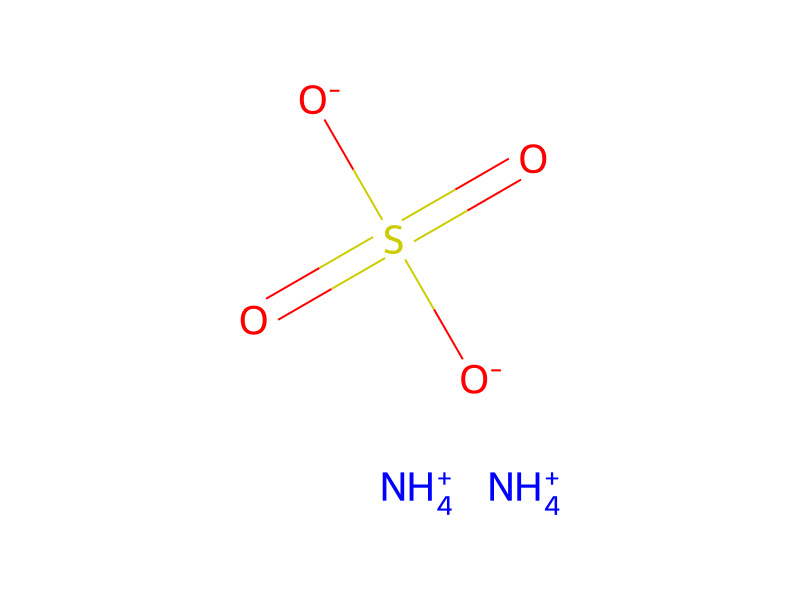
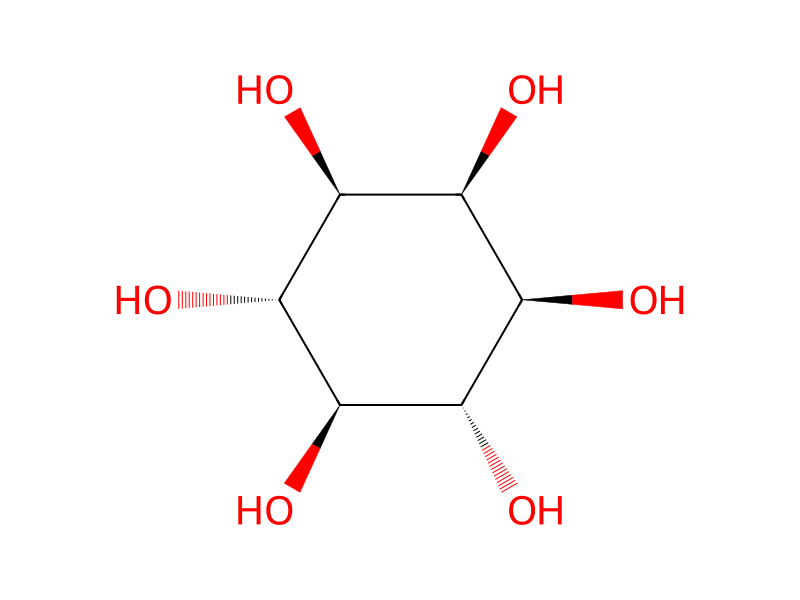
Procedure
The results on batch culture behavior of the YS2 strain in a balanced synthetic nutrient medium containing 50 g/l of glucose are presented in FIG. 2 and Table 2. The ammonium sulfate concentration was 10 g/l. FIG. 2 illustrates glucose concentration 10 (g/l, left vertical axis), cell mass level 20 (g/l, left vertical axis), ethanol concentration 30 (g/l, left vertical axis), and inositol concentration 40 (g/l, right vertical axis) over time (hours, horizontal axis). Once again, two phases of microbial growth are apparent in FIG. 2. In the first phase (0--23 h) glucose is consumed to produce cell mass and ethanol. Once again, in the glucose consumption phase no detectable amount of inositol was produced. In the second phase, ethanol was consumed to produce cell mass. As in the previous experiment, about 170 mg/l of inositol was produced toward the end of the second phase.
Workup
- concentrationglucose concentration 10 (g/l, left vertical axis), cell mass level 20 (g/l, left vertical axis), ethanol concentration 30 (g/l, left vertical axis), and inositol concentration 40 (g/l, right vertical axis) over time (hours, horizontal axis)
- customIn the first phase (0--23 h) glucose is consumed
- customto produce cell mass and ethanol
- customOnce again, in the glucose consumption phase no detectable amount of inositol
- customwas produced
- customIn the second phase, ethanol was consumed
- customto produce cell mass
Sources & evidence
- ORD record
- ord-f4422f81379044f09441176f6f1b5fb4
- Source dataset
- uspto-grants-1994_03
- Patent number
- US05296364
Linked notes
Loading…