Reaction equation

O=C[C@@H]([C@H]([C@@H]([C@@H](CO)O)O)O)O.[CH3:13][C:14]1[NH:19][C:18]([CH3:20])=[C:17]([C:21]([O:23][CH2:24][CH2:25][N:26]([CH2:28][C:29]2[CH:30]=[CH:31][CH:32]=[CH:33][CH:34]=2)[CH3:27])=[O:22])[CH:16]([C:35]2[CH:36]=[CH:37][CH:38]=[C:39]([N+:41]([O-:43])=[O:42])[CH:40]=2)[C:15]=1[C:44]([O:46][CH3:47])=[O:45].Cl>>[CH3:13][C:14]1[NH:19][C:18]([CH3:20])=[C:17]([C:21]([O:23][CH2:24][CH2:25][N:26]([CH2:28][C:29]2[CH:34]=[CH:33][CH:32]=[CH:31][CH:30]=2)[CH3:27])=[O:22])[CH:16]([C:35]2[CH:36]=[CH:37][CH:38]=[C:39]([N+:41]([O-:43])=[O:42])[CH:40]=2)[C:15]=1[C:44]([O:46][CH3:47])=[O:45]Participants


Procedure
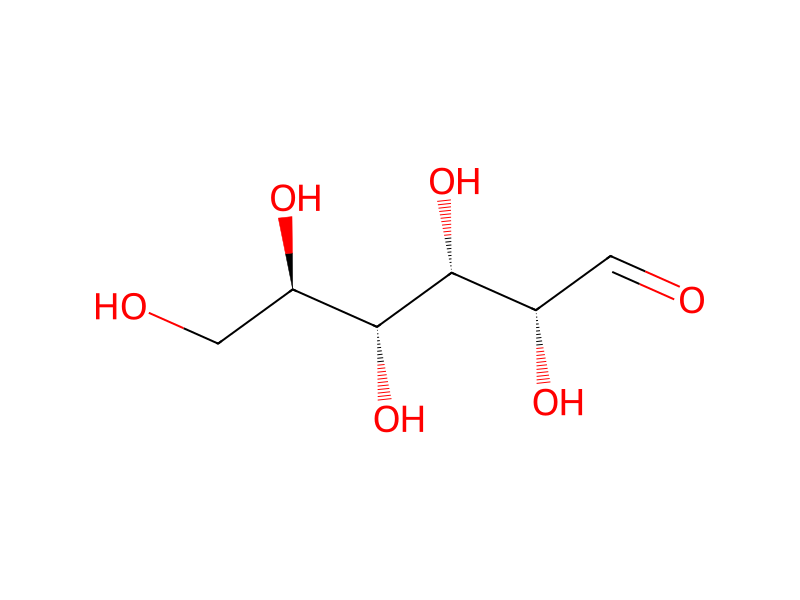
Effect of change in pH of a dextrose solution in the range 3 to 7 pH upon the addition of nicardipine hydrochloride solution was performed by first measuring the initial pH of the individual solutions; thereafter, one (1) volume of nicardipine hydrochloride solution prepared by Example-11 was mixed with nine (9) volumes of dextrose solution and the pH adjusted to a desired value in the range 3 to 7. The pH data are furnished in Table-3; the plot of difference in the pH of nicardipine hydrochloride solution before and after dilution with 5% dextrose solution versus the initial pH of dextrose solution is shown in FIG. 4. For comparison, a similar plot for the pH data reported in U.S. Pat. No. 5,164,405 for buffered and unbuffered nicardipine solution is also provided.
Workup
- customThe pH data are furnished in Table-3
Sources & evidence
- ORD record
- ord-294947f30696487795404cba5c723015
- Source dataset
- uspto-grants-2009_09
- Patent number
- US07585978B2
Linked notes
Loading…